
Rightsize Your Hauler Fleet
By Eric Yeomans, Product Manager, GPPE Products, Volvo Construction Equipment (www.miningmagazine.com)
Is bigger always better? When it comes to articulated haulers, the industry certainly seems to be moving in that direction. Site simulation and telematics can help you determine the ideal size hauler fleet for your aggregate site.
In any mining operations, an articulated hauler is only as effective as its supporting machines — such as the excavators and loaders. Evolving site conditions can also factor into proper fleet sizing. What once was the perfect combination of machines may not be in the future as haul routes change. Thus, properly sizing a hauler requires looking at the site and the fleet holistically, and continuing to monitor fleet utilization over time. Fortunately, many equipment dealers and OEMs offer a range of technologies and services that can make this an easier process than ever before.
SITE SIMULATION
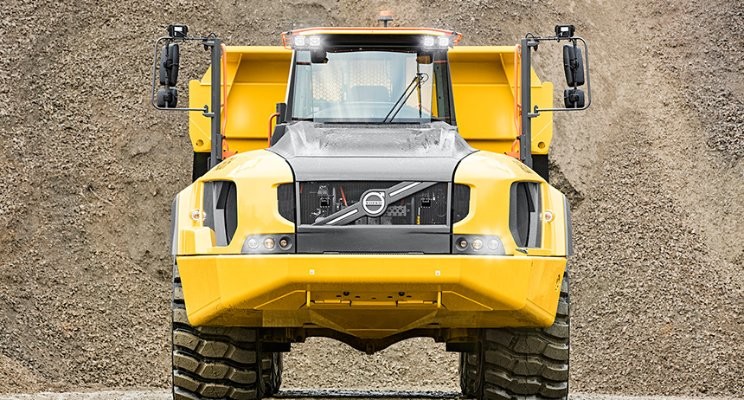
One of the best ways to gain a holistic view of the operation is to conduct an analysis via site simulation software — a process typically completed with the help of an equipment dealer and/or OEM. The process begins by gathering all necessary data points on jobsite conditions. The following will outline, step-by-step, the actual data from a site simulation conducted by Volvo Construction Equipment and a local dealer, for a Virginia limestone quarry owner who was evaluating whether four 60-ton articulated haulers (Volvo A60Hs) would pose efficiencies over five 43-ton articulated haulers (Volvo A40Gs).
Step 1: Jobsite conditions
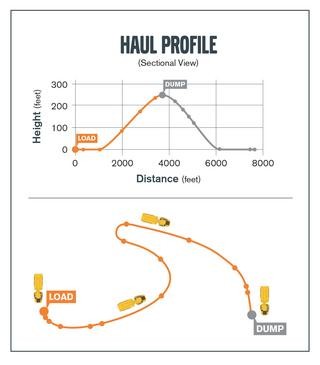
The first step is completed with the help of a handheld GPS device that records and logs site information along the haul route — including haul distances, curves in the haul road and road gradients — factors that all affect cycle times. This data is then imported as a GPX file into a site simulation software program. In the example below, the haul route is 7,286 feet from loading point to dumping site.
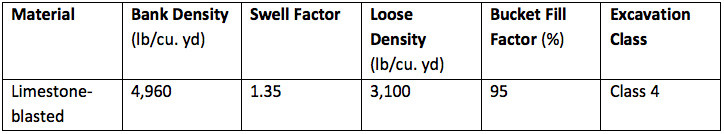
Once GPS data is imported, the fleet manager works hand-in-hand with the OEM or dealer to input a number of jobsite-specific factors, including material information, such as bank density, swell factor, loose density and the estimated average percentage of bucket fill. The software also allows for selecting from several categories of ground conditions in order to calculate rolling resistance of the equipment — a key factor in estimating cycle times and fuel efficiency levels.
Step 2: Operating hours
Next, annual working hours (per machine) are estimated by taking into consideration total scheduled shifts per year, average shift duration (minus non-operating delay per shift) and then subtracting estimated scheduled maintenance. In this instance, the quarry owner estimated 95 percent machine availability, which amounts to 240 8-hour shifts (or 1,824 operating hours) per machine, per year.
Step 3: Equipment specifications
After incorporating GPS information and manually entering jobsite factors, the team then inputs equipment model information, including number of machines, model numbers and bucket size(s). The software will automatically pull the necessary equipment specifications in order to run a production simulation. The team can then run reports with various combinations of equipment models for the loading and hauling units — comparing them side-by-side to arrive at the solution that delivers the best production at the lowest operating cost.
Step 4: Production analysis review
The final production analysis includes data points such average cycle time, average bucket passes to fill hauler, estimated average fuel consumption per hour, and ultimately, a comprehensive fleet analysis outlining fleet production per year in cubic yards. Machine utilization can be further reviewed in a cycle time breakdown, outlining exactly how the hauler is spending time during each cycle, including average load queue time, average spot time at the loading unit, average travel time, average spot time at dump and average dumping time.
In the aforementioned scenario of the Virginia quarry owner, the simulation surprisingly showed the cycle times slightly shorter with the 60-ton A60Hs (9 minutes, 19 seconds) versus the A45Gs (9 minutes, 32 seconds) due to less travel time. In addition, each haul resulted in 9.2 percent more material, which meant fewer cycles and lower fuel consumption, despite the A60s having a larger engine.
The site simulation analysis also shows a difference in fuel consumption of the loader (a Volvo L350F with 9.1 cu. yd. bucket), between the two scenarios, burning more fuel in gallons per operating hour when loading five A40s versus when loading four A60s.
Looking at the important figures of fuel consumption, number of machines, total operating hours and production levels, the team can evaluate cost to operate (including labor and fuel consumption) versus production levels. In the presented scenario, a fleet comprised of four A60s versus five A40s resulted in an estimated savings of 25.6 percent in operating cost.
Step 5: Cost to operate
These figures represent only a part of the picture of total operating cost, however. The dealer or OEM should also work hand-in-hand with the customer to determine total cost of ownership based on a proposed purchase agreement and/or financing structure for both scenarios. Other costs to consider include: depreciation schedule, taxes, insurance, estimated resale value, service plans, tire replacements and maintenance costs.
The results of a cost analysis as in-depth as what is available with site simulations will help fleet managers determine if they need more machines or could benefit from a different size or even type of machine based on all of the information provided.
Once arriving at the most efficient scenario and moving ahead with the recommended fleet structure, it’s important to continue monitoring utilization over time — as haul routes and tasks change with an evolving jobsite. This can be done by once again leveraging the expertise of the equipment dealer and OEM to monitor machine utilization via telematics, but also to make use of the haulers’ on-board weighing data to spot any potential inefficiencies.
INTELLIGENCE = PROFIT
With so much real-time data at your fingertips — and OEMs continuing to provide more optimal size classes that open up new opportunities — spending some time to right-size your fleet may be one of the best decisions you make for your operation’s bottom line.


Responses